How to use LineCollections in Matplotlib
First, import the necessary modules:
import numpy as np
import matplotlib.pyplot as plt
from matplotlib.collections import LineCollection
Then generate some data to plot:
x_array = np.linspace(0,2*np.pi,30)
y_arrays = [np.sin(x_array-i*0.2)+0.3*i for i in x_array]
Choose a colormap and create the collection from the previously generated data
cmap = plt.get_cmap('viridis')
line_segments = LineCollection([list(zip(x_array, y_array)) for y_array in y_arrays], cmap=cmap)
line_segments.set_array(x_array)
Finally, plot the figure:
fig, ax = plt.subplots(1)
ax.set_ylabel('sin(x)')
ax.set_xlabel('x')
ax.set_xlim(0,2*np.pi)
ax.set_ylim(-5,5)
ax.add_collection(line_segments)
axcb = fig.colorbar(line_segments, pad=0.02)
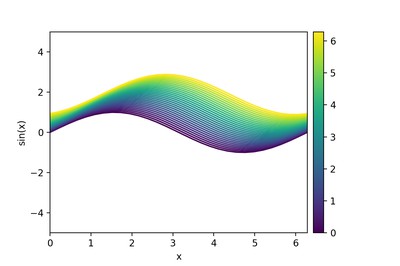
This will generate a plot like this:
Further info on LineCollection can be found in Matplotlib's documentation.